
Vaughan Home Sales Fell 7.63% in August. Prices Went Up Anyway.
Here’s your Vaughan real estate market update for September 2026, built on August’s numbers. It’s a month where the headline and the real story point in opposite directions.
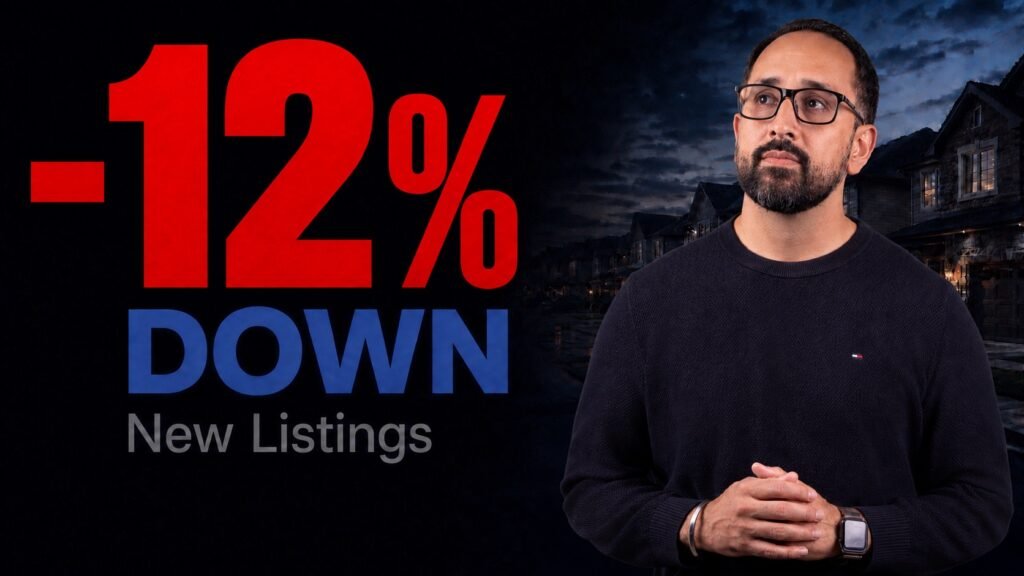
Vaughan sold 242 homes, down 7.63% from last August. Sounds soft. But new listings fell 12.02%, and that’s now four months in a row they’ve come in below last year. Meanwhile the average price actually rose 1.97% to $1,234,758, while the GTA average dropped 2.73%.
Vaughan Numbers Vary by Home Type
Below I’ve broken August down by home type and by neighbourhood, because that one citywide number hides five very different markets. Semis finished the month with only 43 left unsold in the whole city. Condo townhouses finished with 8.0 months of inventory. Those two owners aren’t in the same market at all.
All figures come from the TRREB Market Watch report for August 2026, with rates from the Bank of Canada.
Read on for more!
Search every Vaughan and GTA listing on a live map, get a real home valuation, or just get in touch and ask me. And if you’re curious about the condo side of the city, I keep a separate page on Vaughan Corporate Centre.
The short version: Sales were down. So was almost everything else.
- 242 homes sold, down 7.63%
- New listings down 12.02%
- Homes left unsold at month end down 10.46%
- Average price up 1.97%
Sellers stepped back further than buyers did, and they've been doing it for four months straight. That's the whole month in one line.
Fewer Sales Doesn't Mean Fewer Buyers
"Sales fell 7.63%" is the line you'll see quoted everywhere. On its own it's the least useful number in the report.
Vaughan had 593 new listings in August. Last August it had 674. And when the month closed, 1,198 homes sat unsold, down from 1,338 a year ago.
Less on the shelf means less gets bought. Nothing more dramatic than that.
And this isn't a one-month thing. New listings in Vaughan have come in below last year for four months running.
| Month | New Listings 2026 | Same Month 2025 | Change |
|---|---|---|---|
| May | 821 | 1,056 | -22.25% |
| June | 854 | 899 | -5.01% |
| July | 647 | 889 | -27.22% |
| August | 593 | 674 | -12.02% |
Four months, four declines. That's not a blip, that's a pattern. Sellers have been stepping back from this market since the spring, and it's the single most useful thing to understand about Vaughan right now.
One thing worth clearing up, because people mix these two up constantly:
- The median is the middle price. Half of Vaughan sold above it, half below.
- The average gets dragged around by a few big sales at the top.
This month they disagreed. The average rose 1.97%. The median fell 2.65%. That usually means slightly more high-end detached homes sold than usual. Watch both, not one.
This is the chart I'd actually look at. The blue line sat well under last year's all spring. In July the median was 8.19% below last year. In August that shrank to 2.65%.
It's the closest the two lines have come all year. One month isn't a trend, so I'm not calling it a recovery. But I'll be watching September closely.
How Does Vaughan Compare to the Rest of the GTA?
Vaughan and the region moved in opposite directions on price. That doesn't happen often.
Vaughan's median runs about $298,750 above the GTA median. And our average price rose while the region's fell. Looks like a clean local win.
Except there's a third number, and most updates skip it.
It's called the MLS Home Price Index. It adjusts for which homes sold, so a handful of expensive detached sales can't skew the picture. Across the GTA it's down 4.46% from last year.
So the average says one thing. The benchmark says another. The benchmark is the tougher, more careful read, and it's the one I'd trust. Call August stability in Vaughan. Not a rebound.
One more honest note: Vaughan is carrying slightly more inventory than the region, 4.9 months against 4.6. We're holding value better. We're not a tighter market.
One Vaughan Number Hides Five Different Markets
The citywide average is the wrong number for almost everybody. Here's what your home type actually did.
| Home Type | Sold | Median Price | Average Price | Avg Price YoY | Left at Month End | Months of Inventory | Days on Market |
|---|---|---|---|---|---|---|---|
| Freehold Townhouse | 31 | $1,005,000 | $1,055,000 | -5.63% | 109 | 3.5 | 28 |
| Detached | 122 | $1,425,000 | $1,671,824 | +4.19% | 536 | 4.4 | 30 |
| Condo Apartment | 63 | $525,000 | $607,650 | +0.71% | 431 | 6.8 | 41 |
| Semi-Detached | 14 | $1,022,500 | $1,010,714 | -7.94% | 43 | 3.1 | 34 |
| Condo Townhouse | 9 | $715,000 | $774,669 | -4.07% | 72 | 8.0 | 44 |
| Vaughan, All Types | 242 | $1,148,750 | $1,234,758 | +1.97% | 1,198 | 4.9 | 33 |
Months of inventory by type is homes left unsold divided by homes sold. The 4.9 for Vaughan overall is TRREB's own published trend figure. Semi-detached had 14 sales and condo townhouse had 9, so treat those price changes as directional only.
Now my read on each one.
🏡 Freehold Townhomes
Sellers' marketSales fell off a cliff, down 35.42%. Biggest drop in the city. But look at how the ones that sold behaved: gone in 28 days at 98% of asking. Fastest in Vaughan. That's not a segment in trouble. That's a quiet August. Only 109 were left in the whole city when the month closed.
🏠 Detached
BalancedThe steadiest thing in Vaughan right now. Sales level with last year, average price up 4.19%, and 12.13% fewer sitting unsold. If you own detached here, you're holding the strongest hand this month. Just don't read it as hot. Buyers still took 30 days and still negotiated to 96%.
🏢 Condo Apartments
Most buyer roomPrices here have barely moved in months, up 0.71% on the year. After the slide we've had, flat is good news. But be realistic: 6.8 months of inventory and 41 days to sell. This is a buyer's segment. If you're selling one, price it right in week one. You don't get to test a number and adjust here.
🏚 Semi-Detached
🔥 Tightest in the cityOnly 43 semis were left unsold in all of Vaughan at month end. That's 3.1 months, tightest of anything. Fair warning though: there were 14 sales. The price swings you see are noise at that size. Don't build a pricing plan on them. Build it on the 43.
🏗 Condo Townhomes
Read with careNine sales. I could dress that median up into a story, but with nine homes it's just which nine happened to close. What's real: 8.0 months of inventory, 44 days to sell, and new listings doubled from July. Most negotiable corner of Vaughan right now. Great if you're buying. Less great if you're selling one.
Is Vaughan a Buyer's Market or a Seller's Market?
My favourite number in the whole report answers this. It's called months of inventory. Take everything left unsold, divide it by how fast homes are selling, and you get how long it'd take to empty the shelf if nobody listed again.
- Under 4 months: sellers have the edge
- 4 to 5 months: balanced
- Over 5 months: buyers do
Same city, same month, and the answer flips completely depending on what you own. A semi owner and a condo townhouse owner are in totally different markets on the same street.
So next time someone tells you it's a buyer's market in Vaughan, the fair question back is: in what?
Vaughan Home Prices by Community, August 2026
Five communities sold above the Vaughan average. Thirteen sold below. Top to bottom is almost a 6 times spread.
Somebody asks me about the bottom of this list every single month, so let me answer it here.
Concord and Vaughan Corporate Centre aren't cheap neighbourhoods. They're condo districts. Those averages tell you what kind of home sold there, not what the land is worth. You're comparing towers to estate lots.
My favourite detail this month: East Woodbridge came in at $1,234,350. The Vaughan average was $1,234,758. It missed the city average by $408.
Community figures are neighbourhood-level average sale prices for Vaughan, August 1 to 31, 2026. They come from a different pool than the TRREB citywide numbers above, so read them alongside those figures rather than against them. The dashed reference line is the TRREB Vaughan average.
Four Numbers Behind the Housing Numbers
Borrowing costs have gone quiet, and that matters more than people give it credit for. TRREB's own read is that affordability actually held up this past year, because prices dipped while rates sat still. Their view is that buyer hesitation has been less about the cost of money and more about trade uncertainty with the US.
Remember the lag, too. Deals that closed in August were negotiated in July. Rate news shows up in these numbers a month or two later, not the same week.
What This Means for You
- Buying? Less to choose from, but no bidding frenzy either. Your room to negotiate is in condo apartments (6.8 months) and condo townhouses (8.0). It's thin in semis (3.1) and freehold towns (3.5). Come prepared on detached.
- Selling? Priced right, homes still went in about a month at 97% of asking. On a $1,000,000 ask, that's around $970,000. With listings down 12.02%, you've got less competition than a normal August.
- Staying put? Vaughan's average value edged up 1.97% while the region slipped. That's reassuring. Just keep the benchmark in mind: still down 4.46% GTA-wide.
- Investing? Condo apartments are the one to watch. Most inventory, 41 days to sell, $607,650 average. Patience buys you a better entry price. The catch is they're also slowest to sell when you want out.
My honest read. August looked weak if you only read the sales number. It wasn't. Supply pulled back further than demand, prices held, and the median nearly caught last year.
But the benchmark is still negative across the GTA, so I'm not going to tell you the market has turned. What I will tell you is this: the segment you're in matters far more right now than the citywide headline. Nothing here says rush. It says know which of the five markets you're standing in.
Let's Talk About Your Next Move
Call or text me and I'll give you a straight read on what August means for your street, your home type, and your timeline. I answer my own phone, there's never any pressure, and it's just a neighbourly conversation.
Rated 5.00 on Rate-My-Agent with a 100% recommend rate, and 41 of 43 five-star Google reviews.
No sign-up wall, no follow-up calls unless you ask for one. Use whichever one helps.
I break these numbers down every month on video, and post the short version wherever you already spend your time.
Vaughan Real Estate, Frequently Asked
Sources: TRREB Market Watch, August 2026, August 2025 and July 2026 (citywide and home-type figures); MLS Home Price Index; neighbourhood-level MLS average sale prices for the community section; Bank of Canada; Statistics Canada. All figures in CAD. Year-over-year compares August 2025, month-over-month compares July 2026. Percentages are calculated from the underlying counts and shown to two decimal places. Active listing counts are month-end snapshots: what remained unsold on the last day of the month, not the total that came to market during it.
For information only. Not financial or legal advice. Every situation is different, so talk to a licensed broker before you make a move.