
Vaughan Home Sales Fell 10%, So Why Didn't Prices? | Real Estate Market Update
Vaughan Real Estate Market Update: Are Prices Next?
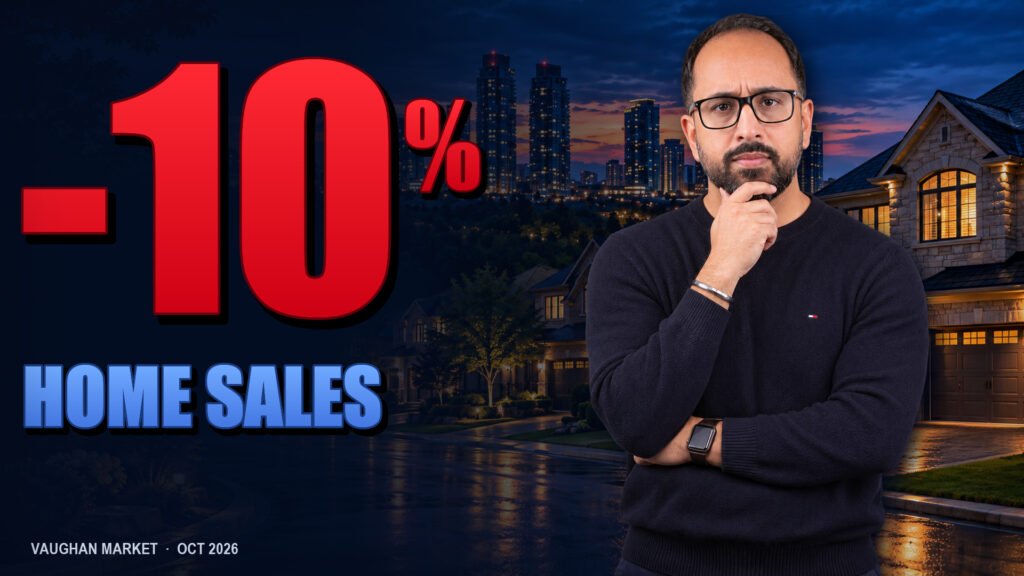
263 homes sold in Vaughan in October. That’s down 10.23% from last year.
And the odd part of this Vaughan real estate market update? The average price barely moved. It’s down just 1.04%.
The Catch: Every Home Type Sold for Less
Detached, semis, freehold towns, condo towns, condo apartments. All five sold for less than a year ago.
So how does the average stay flat? I’ll show you, using TRREB’s October data and the Bank of Canada’s latest hike.
Get a home valuation, search every Vaughan listing on a live map, or just get in touch and ask me.
The short version:
- The average held up for one simple reason, and it's not that prices held. More on that below
- The benchmark, which tracks the same typical home, is down 5.46%
- Detached homes got busier. Only 3.7 months' worth left for sale, down from 5.5 in September
- Condos went the other way. That's where buyers have the most room
So is Vaughan's market crashing? No. It's just softer than the average makes it look.
Is It Just Vaughan?
On average price, Vaughan held up better than most nearby cities. On sales, it didn't.
Vaughan vs its neighbours
| City | Sales vs Last Year | Average Price | Average vs Last Year | Median vs Last Year |
|---|---|---|---|---|
| Vaughan | -10.23% | $1,201,704 | -1.04% | -2.53% |
| City of Toronto | -7.10% | $1,075,627 | +0.54% | -1.18% |
| Markham | -7.47% | $1,117,006 | -9.24% | -7.73% |
| Richmond Hill | +5.71% | $1,193,772 | -10.52% | -5.73% |
| Brampton | -7.44% | $825,183 | -11.67% | -7.94% |
| Mississauga | -8.63% | $927,521 | -4.18% | -5.28% |
| King* | +21.73% | $1,840,060 | -15.40% | -20.52% |
*King had 28 sales, so its swings are directional only. October 2026 vs October 2025, as first published.
Markham's and Brampton's average prices fell a lot more than ours. But fewer buyers stepped back there. Their sales dipped about 7.5%, compared with just over 10% in Vaughan.
The GTA's biggest movers
- Sales, strongest: Newmarket +30.66%, King* +21.73%, Richmond Hill +5.71%
- Sales, weakest: Ajax -27.45%, Milton -24.26%, Oakville -23.29%
- Average price, strongest: Burlington +5.62%, Oakville +1.59%, Ajax +1.50%
- Average price, weakest: King* -15.40%, Brampton -11.67%, Aurora -11.17%
- Median price, strongest: Oakville +0.82%, Halton Hills -0.25%, Whitby -0.87%
- Median price, weakest: King* -20.52%, Oshawa -10.25%, Clarington -9.33%
Ranked: GTA cities with 50 or more sales in October. King is always shown, tagged low volume.
Curious what's for sale near you? Every Vaughan listing is on a live map. Pick a home type and zoom in on your street.
Are Vaughan Home Prices Actually Going Down?
Yes, modestly. The benchmark price shows it more clearly than the average does.
The benchmark (MLS HPI) tracks the price of the same typical home over time. A few extra big houses selling doesn't move it. That's why I check it first.
- $1,106,600 Vaughan benchmark, down 5.46% from last October
- $916,400 GTA benchmark, down 4.28%
- $1,201,704 Vaughan average, down only 1.04%
So a typical Vaughan home is worth a bit less than a year ago, and we slipped a little more than the GTA. One number says "steady". The other says "down about 5%". Here's where the gap comes from.
Why Did the Average Barely Move?
The city-wide average lumps every home type together. Split them up, and every one of them dropped more than 1.04%.
Swipe the table sideways to see every column.
| Home Type | Sold | Sales vs Last Year | Average Price | Average vs Last Year | Median Price | Left at Month End | Months of Inventory | Days on Market |
|---|---|---|---|---|---|---|---|---|
| Detached | 147 | -3.28% | $1,550,898 | -2.87% | $1,420,000 | 550 | 3.7 | 32 |
| Freehold Townhouse | 34 | -17.07% | $987,273 | -5.21% | $999,500 | 119 | 3.5 | 32 |
| Semi-Detached* | 18 | +5.88% | $1,013,083 | -5.57% | $970,000 | 44 | 2.4 | 25 |
| Condo Apartment | 57 | -20.83% | $538,647 | -8.34% | $520,000 | 419 | 7.4 | 42 |
| Condo Townhouse* | 6 | -33.33% | $726,417 | -12.79% | $722,250 | 75 | 12.5 | 35 |
| Vaughan, All Types | 263 | -10.23% | $1,201,704 | -1.04% | $1,135,000 | 1,219 | 4.8 | 33 |
*Semi-detached had 18 sales and condo townhouses had 6, so treat their price changes as directional. Months of inventory by type is homes left unsold at month end divided by homes sold; the 4.8 overall is TRREB's trend figure.
So how does the overall number only slip 1.04%? More detached homes sold. They made up 55.89% of sales this October (147 of 263), up from 51.87% a year ago (152 of 293). Detached is Vaughan's priciest home type. When it takes a bigger slice of sales, it lifts the overall average, even though detached prices dropped too.
Put in dollars: compared with last October, the average detached sale was $45,917 lower. The average condo apartment sale was $49,069 lower. That's a slightly bigger dollar hit on a home worth roughly a third as much.
That's why I never price a home off the city average. When someone asks me what their place is worth, I pull recent sales of homes like theirs, close by. That's the number that matters.
Is Vaughan a Buyer's or Seller's Market Right Now?
It depends on what you own. Months of inventory is how long it'd take to sell everything left on the market if nobody listed another home.
- Under 4 months: sellers start to get more say
- 4 to 6 months: balanced
- Over 6 months: buyers have room to negotiate
Detached sellers had a good month. 147 detached homes sold, and that's 39 more than September. Inventory went from 5.5 months to 3.7 in a single month. Freehold townhouses are in the same spot at 3.5.
Fewer sellers listed. 659 new listings, and that's down 18.13% from last October. By month end, 1,219 homes were left unsold, down 16.56%. Homes sold in 33 days on average, 9 days faster than September.
Condos are the opposite. At month end, condos were 40.52% of the homes left for sale (494 of 1,219). But they were only 23.95% of sales (63 of 263). Condo apartment sales fell 20.83% from last October.
The new-home HST rebate is part of the condo story
Ontario's enhanced new-home rebate can give back up to $130,000 in HST on an eligible new home. It has to be the home you'll live in, and the deal has to be signed by March 31, 2027. The full amount applies up to $1.5 million, then it phases out. Builders are already advertising it. I broke down who qualifies in my Ontario HST rebate guide.
I lost a client to it a few months ago. We were looking at semis in Oakville around $1.2 million and lost a couple of bidding wars. I told them to hold the line and not overpay. Then they found a brand-new builder home, about the same size, first listed around $1.15 million. With the rebate, they paid around $1 million. I lost the sale, but they got a great home at a fair price.
Vaughan resale condo sellers are up against the same math right now.
If you're comparing new against resale, read the fine print: closing dates, deposits and when the rebate actually reaches you.
Did the Bank of Canada Rate Hike Affect October?
Barely. It landed on October 28, three days before the month ended. November's numbers will tell us more.
Here's what the hike means in practice:
- On a variable rate? Your rate likely went up. Depending on your mortgage, so did your payment
- Buying? You may qualify for a bit less than you did in September
- Pre-approved a few weeks ago? Get it updated before you shop
The posted 5-year fixed rate (what lenders advertise) was 6.19% in October. Many borrowers get a lower rate than posted, so ask your lender for your real number.
Not sure what your home is worth after all this? Ask me. I'll pull the recent sales that look like yours.
Is the Vaughan Housing Market Still Crashing?
Compared with 2022, yes, prices are a lot lower. Compared with last year, it's a slow slide.
| Vaughan, all types | February 2022 (peak) | October 2026 |
|---|---|---|
| Median price | $1,505,000 | $1,135,000 |
| Average price | $1,607,591 | $1,201,704 |
| Months of inventory | 1.0 | 4.8 |
| Sale-to-list | 112% | 97% |
| Days on market | 11 | 33 |
$1,135,000 is today's median, and that's $370,000 below the peak, down 24.58%. If you bought near the top, that's a real loss on paper.
But most of that drop happened years ago. Over the last 12 months, the benchmark is down 5.46%. And homes are still selling for 97% of asking. On a $1,000,000 list price, that's about $970,000. Prices are still adjusting. They're not collapsing.
What Does This Mean for You?
- Selling a house? Detached and freehold town inventory is under 4 months, and more buyers showed up than in September. Price it right and it should move.
- Selling a condo? Buyers have lots of choice, including new homes with the HST rebate. Get the price right from day one.
- Buying a condo? Take your time. With 7.4 months of inventory, you've got room to negotiate.
- Buying a house? Less room than last month. Update your pre-approval and be ready when the right one comes up.
- Staying put? Ignore the headline average. Your home type and your street say much more about your value.
My bottom line. October only looked steady if you stopped at the average. Every main home type sold for less than a year ago.
Houses actually got busier this month, and condos got quieter. So "prices are holding" isn't quite right, and neither is "crash". The real answer depends on what you own.
I've lived in Vaughan since 2004 and worked in real estate here since 2007. If you want to know where your own home sits, tell me your street and I'll pull the sales that look like yours.
Got a Question About Your Own Home?
Call or text me. Tell me your street and what you're thinking, and I'll walk you through the numbers for it.
Rated 5.00 on Rate-My-Agent (100% would recommend). 42 of 44 Google reviews are five stars.
Free to use. I won't call unless you ask me to.
Every month I walk through these numbers on video. The short versions go on the platforms below.
Vaughan Real Estate FAQ
Sources: TRREB Market Watch, October 2026, September 2026 and October 2025 (citywide, home-type and GTA city figures, MLS Home Price Index), plus February 2022 for the peak comparison; Bank of Canada, October 28, 2026; TRREB, Ontario Enhanced New Housing Rebate. All figures in CAD. "Last year" compares October 2025 as first published; TRREB has since restated some history, so small differences are possible. Percentages are calculated from the underlying figures and shown to two decimal places without rounding, except where a source publishes its own figure. Active listing counts are month-end snapshots: what remained unsold on the last day of the month.
For information only. Not financial, tax or legal advice. Every situation is different, so talk to a licensed broker before you make a move.